Multiple Choice
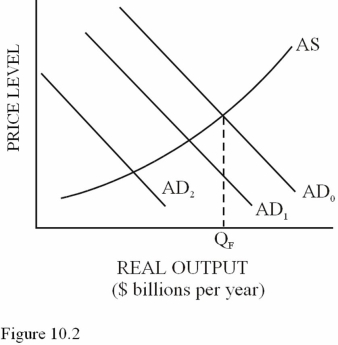
-Suppose the aggregate demand curve in Figure 10.2 increases by a total of $60 billion,from AD2 to AD0. Equilibrium GDP will
A) Increase by less than $60 billion because some of the additional spending drives up prices.
B) Increase by $60 billion.
C) Increase by more than $60 billion because of the multiplier effect.
D) Decrease because higher inflation causes unemployment.
Correct Answer:
Verified
Related Questions
Q76: Unplanned inventory depletion is a warning sign
Q77: Assume the equilibrium level of output is
Q78: An inflationary spiral can emerge when
A)Desired spending
Q79: Demand-pull inflation can develop when
A)There is a
Q80: Because the aggregate supply curve rises more

