Refer to the figure below. This diagram represents the tobacco industry. The socially optimal price and quantity exchanged are 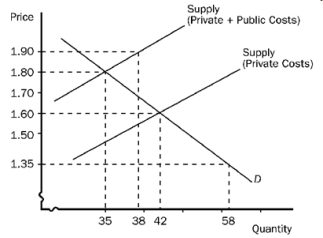
A) €1.90 and 38 units.
B) €1.80 and 35 units.
C) €1.60 and 42 units.
D) €1.35 and 58 units.
Correct Answer:
Verified
Q23: Flu injections are associated with a positive
Q24: Roberto and Thomas live in a university
Q25: Because there are positive externalities from higher
Q26: A benefit of taxes over regulation to
Q27: According to the Coase theorem, private parties
Q29: Which of the following is not considered
Q30: Internalizing an externality means
A) the good becomes
Q31: When an individual buys a car in
Q32: Refer to the figure below. This diagram
Q33: The government engages in a technology policy
A)
Unlock this Answer For Free Now!
View this answer and more for free by performing one of the following actions

Scan the QR code to install the App and get 2 free unlocks

Unlock quizzes for free by uploading documents