Consider the following diagram, and then answer the question below.
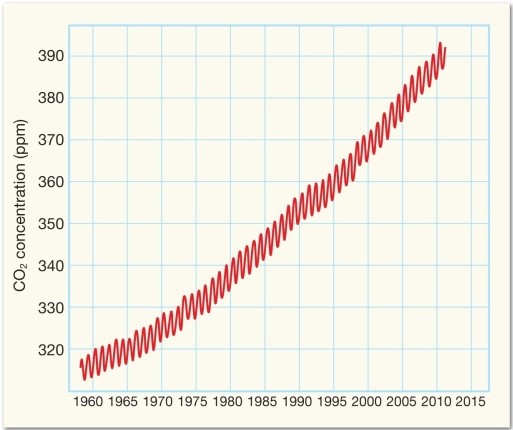
-What best explains the "bumps" seen in the seen in the CO2 concentrations on the graph above?
A) changes in plant growth that result in less CO2 being absorbed during the dormant season
B) a cyclic pattern in the eruption of volcanoes, causing more CO2 to be released each spring
C) greater amounts of CO2 released by the burning of fossil fuels for heat during the winter
D) higher levels of traffic producing more CO2 during the summer travel season
Correct Answer:
Verified
Q4: At sea level, how far can a
Q5: Ozone:
A) protects life on Earth by filtering
Q6: Which of these was NOT involved with
Q7: The most important source of the free
Q8: Consider the following diagram, and then answer
Q10: In which sphere would we find insects,
Q11: The heterosphere and ionosphere BOTH coincide with
Q12: The approximate altitude of auroral displays is:
A)
Q13: The Montreal Protocol:
A) was only signed by
Q14: The ionosphere is an atmospheric region defined
Unlock this Answer For Free Now!
View this answer and more for free by performing one of the following actions

Scan the QR code to install the App and get 2 free unlocks

Unlock quizzes for free by uploading documents