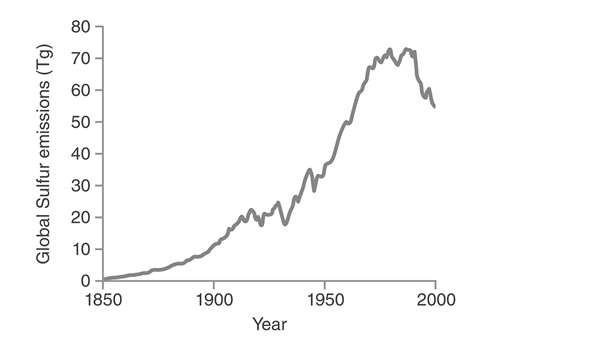
-The trends depicted in the figure are best explained by__________ .
A) an increased use of fossil fuels,followed by recent regulations restricting the production and use of fossil fuels containing sulfur
B) a growth and subsequent decline in the global human population
C) an increased use of fossil fuels,followed by a recent decreased use of fossil fuels
D) an increased use of sulfur- containing fertilizers,followed by a recent replacement of those fertilizers with those that contain phosphorus and nitrogen rather than sulfur
Correct Answer:
Verified
Q18: Fossil fuels were formed from_ .
A)sodium and
Q19: All of the following statements about the
Q20: The volume of Lake Erie is 480
Q21: Which of the following naturally converts)atmospheric nitrogen
Q22: Give a brief overview of the terrestrial
Q23: Cell respiration and photosynthesis are complex processes
Q24: All of the following can be converted
Q25: Which of the following elements is found
Q26: Production of which of the following is
Q28: Biogeochemical cycles involve _.
A)heat loss from both
Unlock this Answer For Free Now!
View this answer and more for free by performing one of the following actions

Scan the QR code to install the App and get 2 free unlocks

Unlock quizzes for free by uploading documents