Use the figure below to answer the following questions.
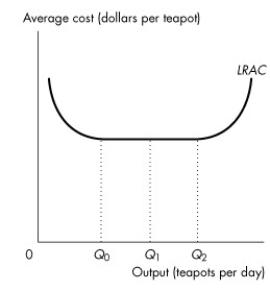 Figure 11.4.4
-Refer to Figure 11.4.4,which illustrates the long-run average total cost curve.Given an increase in output from Q1 to Q2,
A) economies of scale exist.
B) diseconomies of scale exist.
C) constant returns to scale exist.
D) average total cost is increasing.
E) average total cost is decreasing.
Correct Answer:
Verified
Q121: Use the figure below to answer the
Q122: Use the table below to answer the
Q124: Use the figure below to answer the
Q128: The long-run average cost curve is the
Q129: Use the figure below to answer the
Q130: Use the table below to answer the
Q131: Diminishing returns to capital _ occur as
Q141: The minimum efficient scale is the smallest
Q143: Economies of scale refer to the range
Q145: Diseconomies of scale refer to the range
Unlock this Answer For Free Now!
View this answer and more for free by performing one of the following actions

Scan the QR code to install the App and get 2 free unlocks

Unlock quizzes for free by uploading documents