Use the following figure to nswer the question : 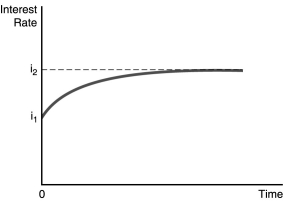
-In the figure above,illustrates the effect of an increased rate of money supply growth at time period 0. From the figure,one can conclude that the
A) Fisher effect is dominated by the liquidity effect and interest rates adjust slowly to changes in expected inflation.
B) liquidity effect is dominated by the Fisher effect and interest rates adjust slowly to changes in expected inflation.
C) liquidity effect is dominated by the Fisher effect and interest rates adjust quickly to changes in expected inflation.
D) Fisher effect is smaller than the expected inflation effect and interest rates adjust quickly to changes in expected inflation.
Correct Answer:
Verified
Q148: Use the following figure to nswer the
Q151: Risk averse investors always prefer to have
Q152: Holding many risky assets and thus reducing
Q153: Use the following figure to nswer the
Q154: The riskiness of an asset that is
Q155: A return to the gold standard,that is,using
Q157: When gold prices become more volatile,the _
Q158: The _ the returns on two securities
Q160: Discovery of new gold in Alaska will
Q161: The price of gold should be _
Unlock this Answer For Free Now!
View this answer and more for free by performing one of the following actions

Scan the QR code to install the App and get 2 free unlocks

Unlock quizzes for free by uploading documents