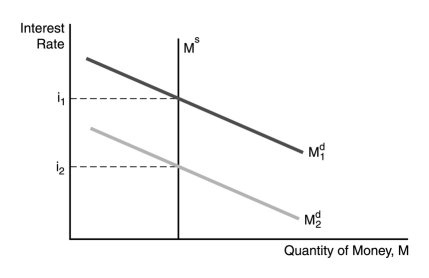
-In the figure above,the decrease in the interest rate from i1 to i2 can be explained by
A) a decrease in money growth.
B) a decline in the expected price level.
C) an increase in income.
D) an increase in the expected price level.
Correct Answer:
Verified
Q102: When the Fed decreases the money stock,the
Q103: When the price level falls,the _ curve
Q104: If there is an excess supply of
Q106: When the Fed _ the money stock,the
Q108: _ in the money supply creates excess
Q111: When the price level _,the demand curve
Q112: If there is an excess demand for
Q112: A rise in the price level causes
Q114: _ in the money supply creates excess
Q116: ![]()
Unlock this Answer For Free Now!
View this answer and more for free by performing one of the following actions

Scan the QR code to install the App and get 2 free unlocks

Unlock quizzes for free by uploading documents