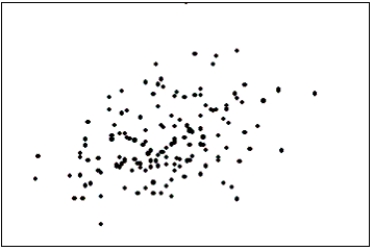
The first scatter diagram below shows a stronger linear relationship than the second scatter diagram.(Assume the scales on both scatter diagrams are the same. ) 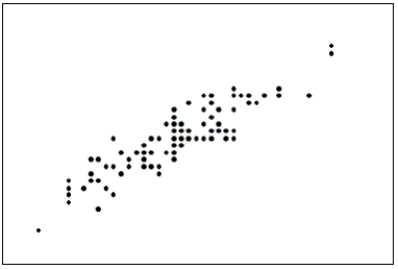
Correct Answer:
Verified
Q62: Briefly discuss the difference between cross-sectional data
Q66: A line chart is created by plotting
Q84: If two variables have a strong linear
Q87: In order to draw a scatter diagram,we
Q88: The two most important characteristics revealed by
Q89: The graphical technique used to describe the
Q92: When two variables are linearly related,and tend
Q96: If we draw a straight line through
Q105: Data for calories and salt content (milligrams
Q110: A professor examines the relationship between minutes
Unlock this Answer For Free Now!
View this answer and more for free by performing one of the following actions

Scan the QR code to install the App and get 2 free unlocks

Unlock quizzes for free by uploading documents