TABLE 14-17
Given below are results from the regression analysis where the dependent variable is the number of weeks a worker is unemployed due to a layoff (Unemploy) and the independent variables are the age of the worker (Age) and a dummy variable for management position (Manager: 1 = yes,0 = no) .
The results of the regression analysis are given below: 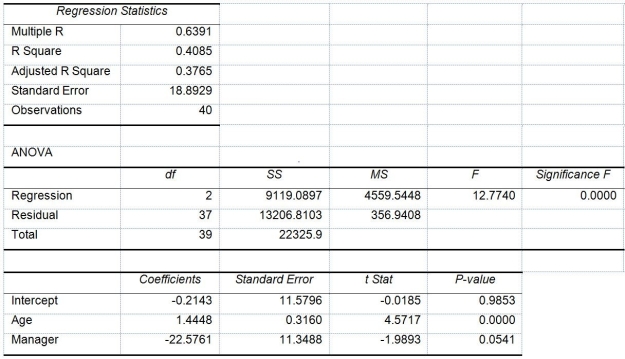
-Referring to Table 14-17,which of the following is the correct alternative hypothesis to determine whether there is a significant relationship between percentage of students passing the proficiency test and the entire set of explanatory variables?
A) H1 : All βj ≠ 0 for j = 0,1,2
B) H1 : All βj ≠ 0 for j = 1,2
C) H1 : At least one of βj ≠ 0 for j = 0,1,2
D) H1 : At least one of βj ≠ 0 for j = 1,2
Correct Answer:
Verified
Q256: TABLE 14-16
What are the factors that determine
Q257: TABLE 14-16
What are the factors that determine
Q258: TABLE 14-16
What are the factors that determine
Q259: TABLE 14-16
What are the factors that determine
Q260: TABLE 14-16
What are the factors that determine
Q262: TABLE 14-17
Given below are results from the
Q263: TABLE 14-17
Given below are results from the
Q264: TABLE 14-17
Given below are results from the
Q265: TABLE 14-17
Given below are results from the
Q266: TABLE 14-17
Given below are results from the
Unlock this Answer For Free Now!
View this answer and more for free by performing one of the following actions

Scan the QR code to install the App and get 2 free unlocks

Unlock quizzes for free by uploading documents