TABLE 18-3
A quality control analyst for a light bulb manufacturer is concerned that the time it takes to produce a batch of light bulbs is too erratic.Accordingly,the analyst randomly surveys 10 production periods each day for 14 days and records the sample mean and range for each day. 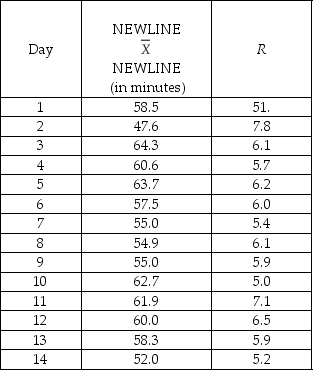
-Referring to Table 18-3,suppose the sample mean and range data were based on 11 observations per day instead of 10.How would this change affect the lower and upper control limits of the R chart?
A) LCL would increase; UCL would decrease.
B) LCL would remain the same; UCL would decrease.
C) Both LCL and UCL would remain the same.
D) LCL would decrease; UCL would increase.
Correct Answer:
Verified
Q34: TABLE 18-4
A factory supervisor is concerned that
Q35: TABLE 18-4
A factory supervisor is concerned that
Q36: TABLE 18-4
A factory supervisor is concerned that
Q37: TABLE 18-3
A quality control analyst for a
Q40: TABLE 18-4
A factory supervisor is concerned that
Q41: TABLE 18-5
A manufacturer of computer disks took
Q42: True or False: In the United States,
Q43: The cause of variation that can be
Q56: TABLE 18-4
A factory supervisor
Q93: TABLE 18-5
A manufacturer of computer disks
Unlock this Answer For Free Now!
View this answer and more for free by performing one of the following actions

Scan the QR code to install the App and get 2 free unlocks

Unlock quizzes for free by uploading documents