The following figure illustrates a utility curve for someone who is a risk seeker. 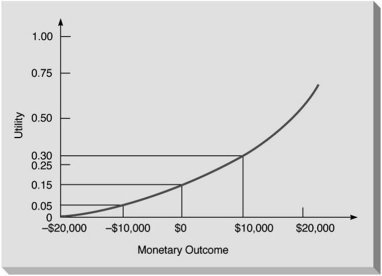
Correct Answer:
Verified
Q20: When using the EOL as a decision
Q21: The assignment of a utility value of
Q22: Which of the following is true about
Q24: A utility curve that shows utility increasing
Q26: Expected monetary value (EMV)is
A)the average or expected
Q28: An analytic and systematic approach to the
Q29: The equally likely decision criterion is also
Q30: Utility values typically range from -1 to
Q32: Utility theory provides a decision criterion that
Q34: A utility curve that shows utility increasing
Unlock this Answer For Free Now!
View this answer and more for free by performing one of the following actions

Scan the QR code to install the App and get 2 free unlocks

Unlock quizzes for free by uploading documents