Use the sales data given below to determine: 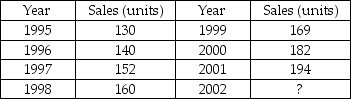 (a) the least squares trend line.
(b) the predicted value for 2002 sales.
(c) the MAD.
(d) the unadjusted forecasting MSE.
Correct Answer:
Verified
View Answer
Unlock this answer now
Get Access to more Verified Answers free of charge
Q65: Given the following data and seasonal index:
Q66: Use simple exponential smoothing with α =
Q67: The following table represents the number of
Q68: Given the following data, if MAD =
Q69: The following table represents the new members
Q69: The errors in a particular forecast are
Q74: The following table represents the actual vs.
Q75: Average starting salaries for students using a
Q90: Demand for a particular type of battery
Q99: Daily high temperatures in the city of
Unlock this Answer For Free Now!
View this answer and more for free by performing one of the following actions

Scan the QR code to install the App and get 2 free unlocks

Unlock quizzes for free by uploading documents