Multiple Choice
Table 16-1 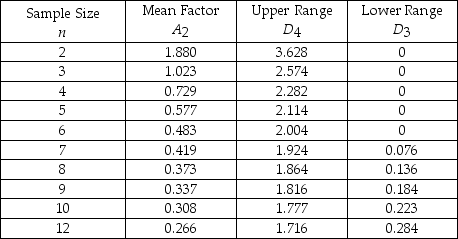
-Refer to Table 16-1. To guarantee that cans of soup are properly filled, some cans are sampled and the amounts measured. The overall average for the samples is 12 ounces. Each sample contains 10 cans. The average range is 0.4 ounces. The upper control chart limit for the sample averages would be
A) 12.1232.
B) 11.8768.
C) 13.2.
D) 12.308.
E) None of the above
Correct Answer:
Verified
Related Questions
Q28: The p-chart would be useful when we
A)took
Q29: Q30: Table 16-1 Q34: Which of the following control charts is/are![]()
![]()

