Exhibit 2-2 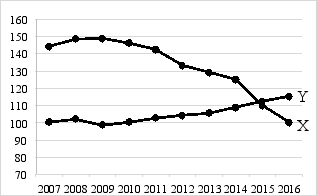
-Exhibit 2-2 shows the relationship between X and Y between 2007 and 2016. Suppose this correlation between X and Y continues to hold for the next 10 years. If Y declines over the period 2017 through 2020, we would expect
A) X to fall over the same period because X and Y are negatively correlated.
B) X to increase over the same period because X and Y are positively correlated.
C) X to increase over the same period because X and Y are negatively correlated.
D) the correlation to be unknown because we do not know the units of measurement for X and Y and thus cannot say anything about how X and Y are related.
E) X to fall over the same period because X and Y are positively correlated.
Correct Answer:
Verified
Q22: Economics has always been a good example
Q23: A microeconomic model must be much smaller
Q24: An economic model is a tool used
Q25: A model gives the most realistic description
Unlock this Answer For Free Now!
View this answer and more for free by performing one of the following actions

Scan the QR code to install the App and get 2 free unlocks

Unlock quizzes for free by uploading documents