Use the following graph to answer the following questions.
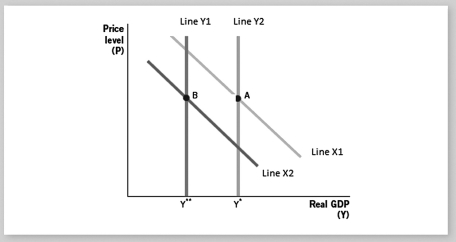
-The difference between lines X1 and X2 represents a(n)
A) aggregate demand change.
B) aggregate demand bubble.
C) long-run aggregate demand bubble.
D) short-run aggregate supply change.
E) long-run aggregate supply change.
Correct Answer:
Verified
Q131: Aside from what occurred with the Great
Q132: Use the following graph to answer the
Q133: The graph below suggests a housing price
Q134: Classical economists stress the importance of aggregate
Q135: In contrast to a typical post-World War
Q137: Use the following graph to answer the
Q138: Use the following graph to answer the
Q139: Macroeconomic policy is
A) the set of laws
Q140: Fiscal policy is
A) the set of laws
Q141: John Maynard Keynes quipped,"In the long run
Unlock this Answer For Free Now!
View this answer and more for free by performing one of the following actions

Scan the QR code to install the App and get 2 free unlocks

Unlock quizzes for free by uploading documents