The graphs below refer to the market for good X.Firms can produce either good X or good Y,which consumers consider to be a substitute for good X.A decrease in the price of good Y will to lead to the shifts shown by 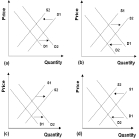
A) Graph (a) .
B) Graph (b) .
C) Graph (c) .
D) Graph (d) .
E) Both Graph (a) and Graph (d) .
Correct Answer:
Verified
Q161: In 1996,"mad cow" disease caused the European
Q162: When economists refer to small buyers in
Q164: The supply and demand model is not
Q165: The supply and demand model is not
Q167: Refer to the graphs below.In the 1990s,corporations
Q167: Since 1990,per-capita income in China has risen.In
Q171: Refer to the graphs below.A recent report
Q172: Season tickets to the Toronto Maple Leafs
Q175: If both buyers and sellers expect the
Q176: When economists refer to small sellers in
Unlock this Answer For Free Now!
View this answer and more for free by performing one of the following actions

Scan the QR code to install the App and get 2 free unlocks

Unlock quizzes for free by uploading documents