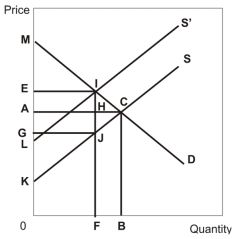
 In the diagram above,D represents the original demand curve,S represents the original supply curve,and S' represents the supply curve once a per-unit tax is imposed.
-Refer to the diagram above.Using supply and demand curves S and D,total economic surplus is represented by the area
A) MLI.
B) AKC.
C) MAC.
D) MKC.
E) IJC.
Correct Answer:
Verified
Q168: Q169: Which of the following is an example Q170: If a price ceiling is imposed on Q171: The success of any policy designed to Q172: For an equilibrium to be socially optimal,it Q174: The equilibrium principle implies that the market Q175: In general,a $1 tax placed on each Q176: Adam Smith showed that the individual pursuit Q177: The resulting reduction in total economic surplus Q178: Which of the following is an example![]()
Unlock this Answer For Free Now!
View this answer and more for free by performing one of the following actions

Scan the QR code to install the App and get 2 free unlocks

Unlock quizzes for free by uploading documents