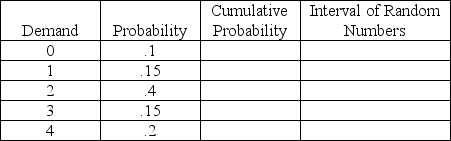
Suppose the following random numbers (1, 34, 22, 78, 56, 98, 00, 82) were selected during a Monte Carlo simulation that was based on the chart below. What was the average demand per period for the simulation? What is the expected demand?
Correct Answer:
Verified
View Answer
Unlock this answer now
Get Access to more Verified Answers free of charge
Q1: State the three-fold idea behind simulation.
Q61: Explain how Monte Carlo simulation uses random
Q81: The lunch counter at a small restaurant
Q82: A small store is trying to determine
Q83: Complete the following table in preparation for
Q87: Complete the following table in preparation for
Q88: A distribution of service times at a
Q88: Historical records on a certain product indicate
Q89: Julie's Diamond Boutique is very concerned with
Q90: A distribution of service times at a
Unlock this Answer For Free Now!
View this answer and more for free by performing one of the following actions

Scan the QR code to install the App and get 2 free unlocks

Unlock quizzes for free by uploading documents