A waiting-line problem that cannot be modeled by standard distributions has been simulated. The table below shows the result of a Monte Carlo simulation. (Assume that the simulation began at 8:00 a.m. and there is only one server.
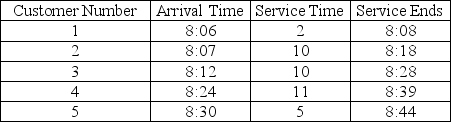 a. What is the average waiting time in line?
b. What is the average time in the system?
Correct Answer:
Verified
View Answer
Unlock this answer now
Get Access to more Verified Answers free of charge
Q29: Explain what is meant by the concept
Q46: The numbers used to represent each possible
Q47: A distribution of service times at a
Q57: Which of the following restrictions applies to
Q59: A(n) _ is the accumulation of individual
Q63: Explain what is meant by "simulation is
Q65: Identify, in order, the five steps required
Q73: Provide a small example illustrating how random
Q80: A distribution of service times at a
Q83: A distribution of service times at a
Unlock this Answer For Free Now!
View this answer and more for free by performing one of the following actions

Scan the QR code to install the App and get 2 free unlocks

Unlock quizzes for free by uploading documents