Refer to the information provided in Figure 26.2 below to answer the question(s) that follow. 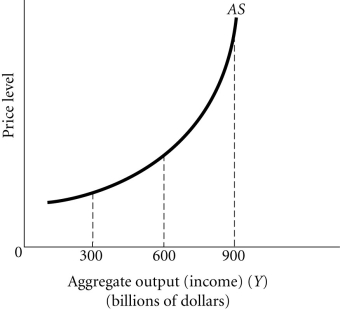 Figure 26.2
-Refer to Figure 26.2. Between the output levels of $300 billion and $600 billion, the relationship between the price level and output is
A) negative.
B) positive.
C) constant.
D) There is no relationship between the price level and output.
Correct Answer:
Verified
Q1: What determines the slope of the aggregate
Q12: Refer to the information provided in Figure
Q13: Refer to the information provided in Figure
Q17: If the economy is operating way below
Q17: Refer to the information provided in Figure
Q18: Refer to the information provided in Figure
Q19: Refer to the information provided in Figure
Q20: When the aggregate supply curve is horizontal,
A)
Q20: Refer to the information provided in Figure
Q21: Refer to the information provided in Figure
Unlock this Answer For Free Now!
View this answer and more for free by performing one of the following actions

Scan the QR code to install the App and get 2 free unlocks

Unlock quizzes for free by uploading documents