Essay
Refer to the table below. Analyze the data on the number of meals served at small and large restaurants. The number of meals served will vary with the number of cooks employed at the restaurant. 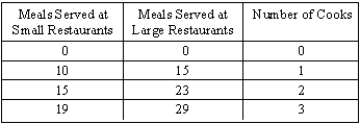 (A)Show the relationship between cooks and meals served by graphing two curves with cooks on the horizontal axis and the number of meals on the vertical axis. How do the slopes of the curves change as more cooks are employed?
(B)Is the change in the number of cooks a shift in the curve or a movement along the curve?
(C)Is the change in the size of the restaurant a shift in the curve or a movement along the curve?
Correct Answer:
Verified
(A)The relationship between cooks and me...
View Answer
Unlock this answer now
Get Access to more Verified Answers free of charge
Related Questions

