Multiple Choice
Exhibit 2A-5
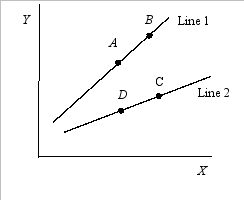
-Refer to Exhibit 2A-5. Which of the following would best explain the shift from line 1 to line 2?
A) An increase in X
B) A decline in Y
C) A decrease in X
D) A change in a third variable, Z, which affects the relationship between Y and X
E) An increase in the slope
Correct Answer:
Verified
Related Questions
Q132: The table below shows the inflation rate
Q133: Exhibit 2A-4 Q134: Refer to the table below, which shows Q135: A two-dimensional graph cannot be used to Q136: Exhibit 2A-5 Q138: Suppose a curve shows that every time Unlock this Answer For Free Now! View this answer and more for free by performing one of the following actions Scan the QR code to install the App and get 2 free unlocks Unlock quizzes for free by uploading documents![]()
![]()

