Suppose the relationship between real GDP and inflation is depicted as shown in the table below. Assume that real and potential GDP are equal to each other at $5,400 billion. Suppose government purchases decline by $100 billion and the slope of the aggregate expenditure line is 0.5. 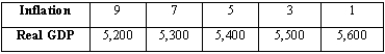 (A)Explain how the AD curve is affected by this change. In the short run, what will real GDP and the rate of inflation be?
(B)Using the AD and IA curves, show what will happen in the medium run. Be sure to give an economic explanation for what is happening.
(C)Using the AD and IA curves, show what will happen in the long run.
Correct Answer:
Verified
View Answer
Unlock this answer now
Get Access to more Verified Answers free of charge
Q44: A decrease in government purchases causes the
Q46: Which of the following would lead to
Q56: If government spending decreases, the long-run income
Q62: If the Fed thinks inflation is too
Q66: If the Fed raises interest rates because
Q67: Why do net exports increase when government
Q68: Which of the following is the best
Q72: According to the spending allocation model, what
Q75: The long-run effect of a change in
Q79: If the Fed is worried about inflation
Unlock this Answer For Free Now!
View this answer and more for free by performing one of the following actions

Scan the QR code to install the App and get 2 free unlocks

Unlock quizzes for free by uploading documents