The graph in the figure shows the net force acting on a 3.0-kg object as a function of time. 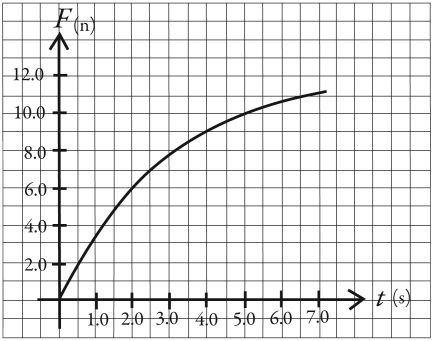 (a)What is the acceleration of this object at time t = 2.0 s?
(b)Draw,to scale,a graph of the acceleration of this object as a function of time over the range t = 0.00 s to t = 7.0 s.
Correct Answer:
Verified
(b)The acceleration...
View Answer
Unlock this answer now
Get Access to more Verified Answers free of charge
Q17: A crate is sliding down an inclined
Q21: On its own,a certain tow-truck has a
Q22: A child on a sled starts from
Q23: The figure shows two forces acting on
Q24: Two forces act on a 
Q26: The graph in the figure shows the
Q27: The figure shows a graph of the
Q28: The figure shows a graph of the
Q29: The figure shows two forces,each of magnitude
Q30: The figure shows two forces acting at
Unlock this Answer For Free Now!
View this answer and more for free by performing one of the following actions

Scan the QR code to install the App and get 2 free unlocks

Unlock quizzes for free by uploading documents