A graph of the force on an object as a function of its position is shown in the figure.Determine the amount of work done by this force on the object during a displacement from x = -2.00 m to x = 2.00 m.(Assume an accuracy of 3 significant figures for the numbers
On the graph.) 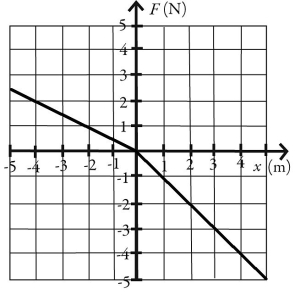
A) -12.0 J
B) -3.00 J
C) -1.00 J
D) 12.0 J
E) 3.00 J
Correct Answer:
Verified
Q1: A student slides her 80.0-kg desk across
Q32: Block A (0.40 kg)and block B (0.30
Q33: A force on a particle depends on
Q35: An object attached to an ideal massless
Q36: In the figure,a constant external force P
Q38: A graph of the force on an
Q39: For the vectors shown in the figure,assume
Q40: A crane lifts a 425 kg steel
Q42: A person pushes horizontally on a heavy
Q53: A 5.00-kg box slides 4.00 m across
Unlock this Answer For Free Now!
View this answer and more for free by performing one of the following actions

Scan the QR code to install the App and get 2 free unlocks

Unlock quizzes for free by uploading documents