Figure 16-3
Panel (a) Panel (b) 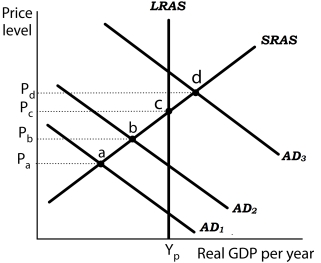
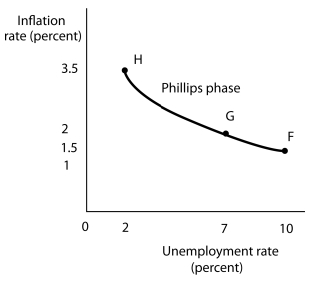 Suppose the level of potential output (YP) is $1,000 billion and the natural rate of unemployment is 5%. In Panel (a) , the aggregate demand curve in Period 1 is AD1. Assume that the price level in Period 1 has risen by 1.5% from the previous period and the unemployment rate is 10%. Thus, in Panel (b) point F shows an initial rate of inflation of 1.5% and an unemployment rate of 10%. Similarly, point b in Panel (a) corresponds to point G in Panel (b) and point d in Panel (a) corresponds to point H in Panel (b) .
-Refer to Figure 16-3. Suppose the economy is operating at point a. What happens if Jpolicymakers undertake expansionary policies in period 1?
A) Aggregate demand in period 2 shifts to AD2 and the new combination of inflation and unemployment rates for period 2 is given by point G.
B) Aggregate demand shifts until point c in panel (a) is reached and the unemployment rate for period 2 is the natural rate.
C) Aggregate demand in period 2 shifts to AD2 and the new combination of inflation and unemployment rates for period 2 is given by point H.
D) Aggregate demand in period 2 shifts to AD3 and the new combination of inflation and unemployment rates for period 2 is given by point H.
Correct Answer:
Verified
Q46: The essential feature of a stagflation phase
Q47: Figure 16-7 Q47: In the short run, if the economy Q48: Figure 16-7 Q49: The critical feature of the Q53: Figure 16-6 Q54: The Phillips phase of the inflation-unemployment relationship Q54: Figure 16-7 Q55: Figure 16-3 Q57: Figure 16-7 Unlock this Answer For Free Now! View this answer and more for free by performing one of the following actions Scan the QR code to install the App and get 2 free unlocks Unlock quizzes for free by uploading documents![]()
![]()
A) Phillips phase![]()
![]()
Panel (a) Panel (b) 
![]()

