Use the figure below to answer the following questions. 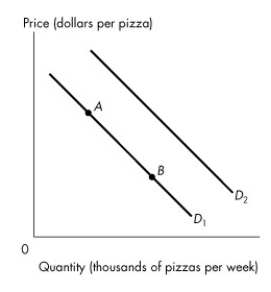 Figure 3.2.2
-Refer to Figure 3.2.2.If consumers' income increases,
A) the quantity of pizzas demanded increases.
B) the demand curve for pizzas shifts from D1 to D2 if a pizza is a normal good.
C) the supply of pizzas increases.
D) the quantity of pizzas supplied decreases.
E) a movement from point A to point B on D1 occurs.
Correct Answer:
Verified
Q29: The price of good A rises,and the
Q30: Use the figure below to answer the
Q31: Good A is a normal good if
A)a
Q32: Use the figure below to answer the
Q33: Which of the following "other things" are
Q35: An increase in income
A)increases the demand for
Q36: Use the figure below to answer the
Q37: The price of good X falls and
Q38: Use the figure below to answer the
Q39: A decrease in quantity demanded is represented
Unlock this Answer For Free Now!
View this answer and more for free by performing one of the following actions

Scan the QR code to install the App and get 2 free unlocks

Unlock quizzes for free by uploading documents