Use the figure below to answer the following questions. 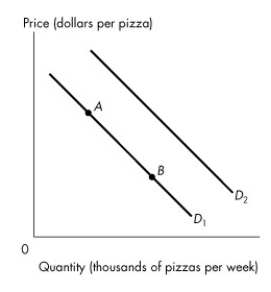 Figure 3.2.2
-Which one of the following would result in the demand curve shifting from D1 to D2 in Figure 3.2.2?
A) an increase in the supply of pizza
B) a rise in the price of spaghetti,a substitute for pizza
C) a rise in the price of pizza
D) a fall in the price of pizza
E) a rise in the price of Coke,a complement of pizza
Correct Answer:
Verified
Q17: The money price of a litre of
Q18: Use the table below to answer the
Q19: The demand and supply model determines
A)relative prices.
B)money
Q20: Use the table below to answer the
Q21: Some sales managers are talking shop.Which one
Q23: Use the figure below to answer the
Q24: Some sales managers are talking shop.Which one
Q25: Some sales managers are talking shop.Which of
Q26: Which one of the following would lead
Q27: A turnip is an inferior good if
A)an
Unlock this Answer For Free Now!
View this answer and more for free by performing one of the following actions

Scan the QR code to install the App and get 2 free unlocks

Unlock quizzes for free by uploading documents