Use the figure below to answer the following question. 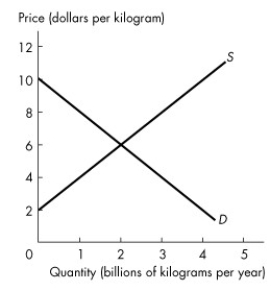 Figure 6.4.1
-Refer to Figure 6.4.1.The graph shows the market for tomatoes.When the government introduces a subsidy for tomatoes at $4 a kilogram,the quantity produced is ________ because ________.
A) efficient;marginal social cost is less than marginal social benefit
B) efficient;marginal social benefit equals marginal social cost
C) inefficient;marginal social cost is less than marginal social benefit
D) inefficient;marginal social benefit is less than marginal social cost
E) inefficient;marginal social cost is zero
Correct Answer:
Verified
Q112: Use the table below to answer the
Q113: In a market with an effective production
Q114: Consider a market for an illegal good.If
Q115: Suppose the cost of breaking the law
Q116: If enforcement is aimed at sellers of
Q118: If enforcement is aimed at buyers of
Q119: A production quota is set equal to
Q120: Use the table below to answer the
Q121: All of the following statements about legalizing
Q122: Suppose that buying and selling a certain
Unlock this Answer For Free Now!
View this answer and more for free by performing one of the following actions

Scan the QR code to install the App and get 2 free unlocks

Unlock quizzes for free by uploading documents