Use the figure below to answer the following question. 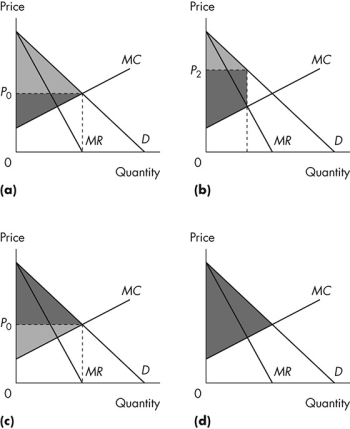 Figure 12.4.4
-Refer to Figure 12.4.4.The light grey area shows consumer surplus and the dark grey area shows producer surplus.Which graph illustrates a perfect price-discriminating monopoly?
A) (a)
B) (b)
C) (c)
D) (d)
E) (a) and (c)
Correct Answer:
Verified
Q85: Use the information below to answer the
Q86: When a monopoly practices price discrimination
A)it charges
Q87: Use the information below to answer the
Q88: Use the figure below to answer the
Q89: An efficient use of resources occurs when
A)a
Q91: Use the figure below to answer the
Q92: Use the figure below to answer the
Q93: Use the figure below to answer the
Q94: The more perfectly a monopoly can price
Q95: Donna owns the only dog grooming salon
Unlock this Answer For Free Now!
View this answer and more for free by performing one of the following actions

Scan the QR code to install the App and get 2 free unlocks

Unlock quizzes for free by uploading documents