Use the following to answer question: 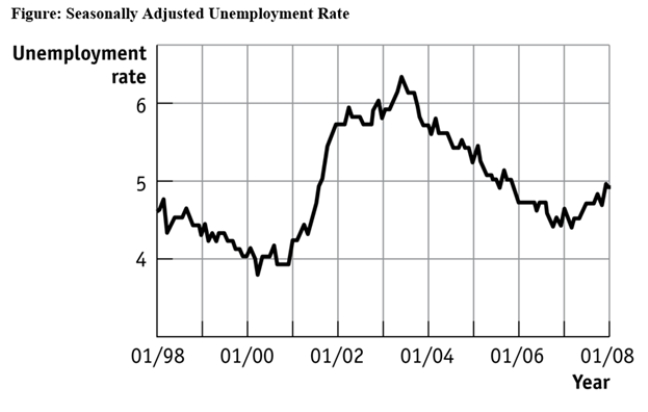
-(Figure: Seasonally Adjusted Unemployment Rate) Use Figure: Seasonally Adjusted Unemployment Rate.The distance between each labeled point on the horizontal axis is one year,and the distance between each labeled point on the vertical axis is one percentage point of unemployment.Unemployment was _____ between 1/2001 and 1/2003 and _____ between 1/2007 and 1/2008.
A) increasing;decreasing
B) increasing;increasing
C) decreasing;increasing
D) decreasing;decreasing
Correct Answer:
Verified
Q24: Use the following to answer question:
Q25: Use the following to answer question:
Q26: Use the following to answer question:
Q27: Use the following to answer question:
Q28: Your boss asks you to graph company
Q30: Use the following to answer question:
Q31: Use the following to answer question:
Q32: Use the following to answer question:
Q33: Use the following to answer question:
Q34: Use the following to answer question:
Unlock this Answer For Free Now!
View this answer and more for free by performing one of the following actions

Scan the QR code to install the App and get 2 free unlocks

Unlock quizzes for free by uploading documents