 Figure 2.5.3
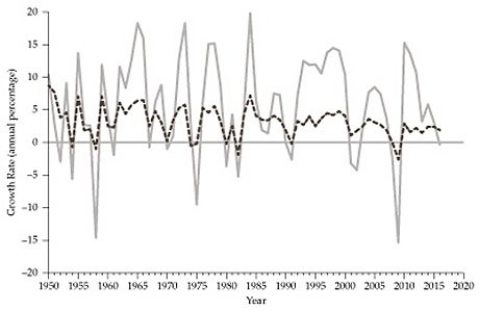
-Refer to Figure 2.5.3 above. The graph , as it appears in the textbook, shows two series, each corresponding to a growth rate. The dashed trend series corresponds to:
A) the growth rate of durable equipment.
B) the growth rate of GDP.
C) The growth rate of non-durable goods.
D) the growth rate of labor productivity.
Correct Answer:
Verified
Q108: Q109: A simple linear demand function may be Q110: When supply is written as Q = Q111: For computers and other business equipment, small Q112: Q114: Q115: Q116: Suppose the observed annual quantity of steel Q117: Suppose the observed annual quantity of steel Q118: Unlock this Answer For Free Now! View this answer and more for free by performing one of the following actions Scan the QR code to install the App and get 2 free unlocks Unlock quizzes for free by uploading documents![]()
![]()
![]()
![]()
![]()

