 Figure 9.2.1
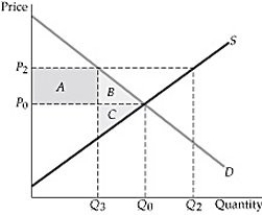
-Refer to Figure 9.2.1 above. When the minimum imposed price is P2, area C in the figure is best interpreted as:
A) the gain associated with the increase in price that producers receive.
B) the loss in producer surplus as a result of the decrease in quantity supplied.
C) a portion of the consumer surplus passed on to producers.
D) the loss in surplus associated with the cost of the additional resulting production.
Correct Answer:
Verified
Q41: Suppose a competitive market is in equilibrium
Q42: Q43: Q44: In an unregulated, competitive market we could Q45: The market demand curve for a popular Q47: Under a binding price ceiling, what does Q48: The demand and supply functions for oil Q49: Governments may successfully intervene in competitive markets Q50: Under a binding price ceiling, what does Q51: The elected officials in a west coast![]()
![]()
Unlock this Answer For Free Now!
View this answer and more for free by performing one of the following actions

Scan the QR code to install the App and get 2 free unlocks

Unlock quizzes for free by uploading documents