Multiple Choice
Exhibit 6-29 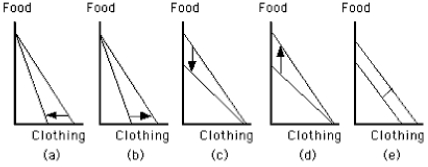
-Which graph in Exhibit 6-29 shows the effect of an increase in the price of clothing and a decrease in the price of food?
A) Graph a
B) Graph b
C) Graph c
D) Graph d
E) none of these
Correct Answer:
Verified
Related Questions
Q82: What would happen to the budget line
Q89: People change their consumption choices in response
Q90: If a good is inferior, an increase
Q91: A consumer allocates income between clams and

