Exhibit 6-29 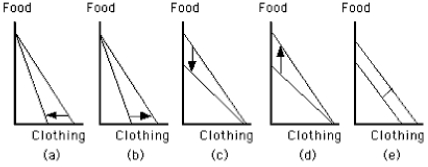
-Which graph in Exhibit 6-29 shows a decrease in the price of food?
A) Graph a
B) Graph b
C) Graph c
D) Graph d
E) Graph e
Correct Answer:
Verified
Q82: What would happen to the budget line
Q89: People change their consumption choices in response
Q95: Exhibit 6-30 Q97: Exhibit 6-30 Q99: A consumer allocates income between clams and Q101: This morning, Yoriko Dazai learned that the Q103: For inferior goods, a rise in price Q104: Although some of the statements below are Q105: Combinations of goods along an indifference curve Q106: If clams and mussels are normal goods,![]()
![]()
Unlock this Answer For Free Now!
View this answer and more for free by performing one of the following actions

Scan the QR code to install the App and get 2 free unlocks

Unlock quizzes for free by uploading documents