Multiple Choice
Exhibit 6-29 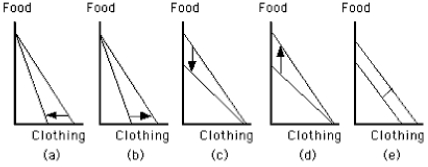
-Which graph in Exhibit 6-29 shows an increase in the price of food?
A) Graph a
B) Graph b
C) Graph c
D) Graph d
E) Graph e
Correct Answer:
Verified
Related Questions
Q71: If the marginal utilities per dollar are
Q72: If a consumer allocates income between goods

