The graph below shows the numbers, in thousands, of men and women of a given height in a population.This graph allows us to conclude that: 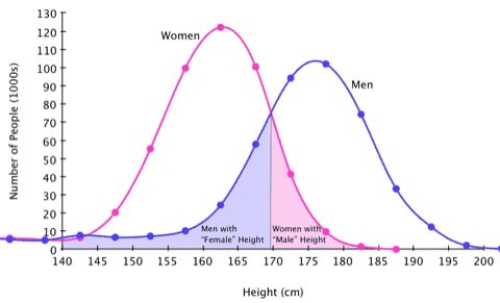
A) Women are taller than men.
B) The most common height for women is about 160 centimeters.
C) The most common height for men is about 170 centimeters.
D) There are fewer tall men than tall women.
Correct Answer:
Verified
Q26: The graph below shows the value, in
Q27: Which of the following stories best fits
Q28: The graph below shows the maximum angle
Q29: The graph below shows the blood-glucose levels,
Q30: The graph below shows the value, in
Q32: Below is a graph of a function
Q33: The graph below shows the maximum angle
Q34: The graph below shows the fundraising of
Q35: The graph below shows the atmospheric pressure,
Q36: Which of the following stories best fits
Unlock this Answer For Free Now!
View this answer and more for free by performing one of the following actions

Scan the QR code to install the App and get 2 free unlocks

Unlock quizzes for free by uploading documents