The graph below shows the value, in dollars, of a foreign currency t years after 2000. For what two dates between 2000 and 2020 would earn you the most money if you bought the foreign currency on the first date and sold on the second?
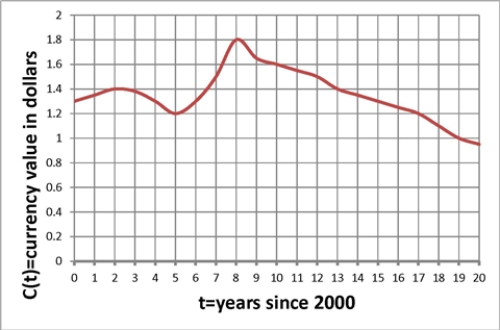
A) Buy in 2002 and sell in 2008
B) Buy in 2008 and sell the same year
C) Buy in 2005 and sell in 2008
D) None of the above
Correct Answer:
Verified
Q21: The graph below shows the numbers, in
Q22: The graph below shows the atmospheric pressure
Q23: Which of the following stories best fits
Q24: Which of the following stories best fits
Q25: The graph below shows the fundraising
Q27: Which of the following stories best fits
Q28: The graph below shows the maximum angle
Q29: The graph below shows the blood-glucose levels,
Q30: The graph below shows the value, in
Q31: The graph below shows the numbers, in
Unlock this Answer For Free Now!
View this answer and more for free by performing one of the following actions

Scan the QR code to install the App and get 2 free unlocks

Unlock quizzes for free by uploading documents