The graph below shows the value, in dollars, of a foreign currency t years after 2000. In what year from 2000 to 2020 did the value of the foreign currency reach its maximum, and what was that maximum value?
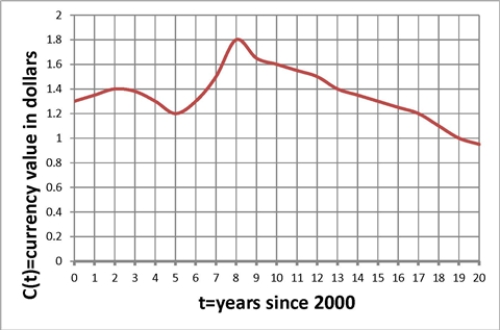
A) The maximum value of $1.80 occurred in 2008.
B) The maximum value of $1.20 occurred in 2005.
C) The maximum value of $1.40 occurred in 2002.
D) The maximum value of $0.90 occurred in 2020.
Correct Answer:
Verified
Q25: The graph below shows the fundraising
Q26: The graph below shows the value, in
Q27: Which of the following stories best fits
Q28: The graph below shows the maximum angle
Q29: The graph below shows the blood-glucose levels,
Q31: The graph below shows the numbers, in
Q32: Below is a graph of a function
Q33: The graph below shows the maximum angle
Q34: The graph below shows the fundraising of
Q35: The graph below shows the atmospheric pressure,
Unlock this Answer For Free Now!
View this answer and more for free by performing one of the following actions

Scan the QR code to install the App and get 2 free unlocks

Unlock quizzes for free by uploading documents