The graph below shows the maximum angle above the horizon reached by the moon during the month of June.What was the average rate of change in the maximum angle from June 8 to June 14? 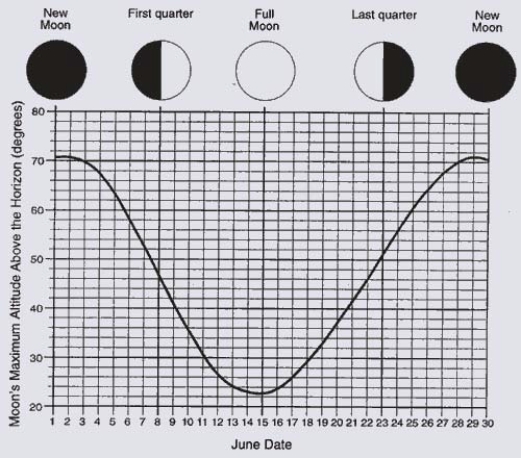
A) -3.43 degrees per day
B) -16 degrees per day
C) -7 degrees per day
D) None of the above.
Correct Answer:
Verified
Q28: The graph below shows the maximum angle
Q29: The graph below shows the blood-glucose levels,
Q30: The graph below shows the value, in
Q31: The graph below shows the numbers, in
Q32: Below is a graph of a function
Q34: The graph below shows the fundraising of
Q35: The graph below shows the atmospheric pressure,
Q36: Which of the following stories best fits
Q37: The graph below shows the blood-glucose levels,
Q38: The graph below shows the growth rate
Unlock this Answer For Free Now!
View this answer and more for free by performing one of the following actions

Scan the QR code to install the App and get 2 free unlocks

Unlock quizzes for free by uploading documents