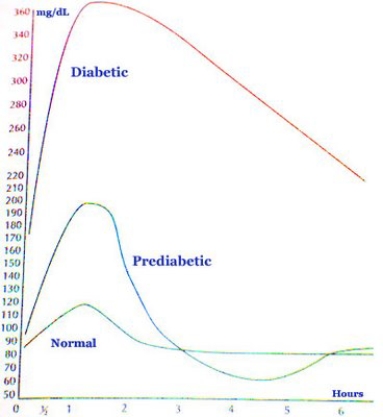
The graph below shows the blood-glucose levels, in milligrams per deciliter, as a function of hours since a meal was ingested.The three graphs are for a healthy person (labeled normal) , a prediabetic, and a diabetic person.During the period shown on the graph, what is the shortest time since eating that glucose levels are the same for a healthy person and a prediabetic?
A) About 6 hours after eating
B) About 3 hours after eating
C) At about 1 hour after eating
D) None of the above
Correct Answer:
Verified
Q28: The graph below shows the maximum angle
Q29: The graph below shows the blood-glucose levels,
Q30: The graph below shows the value, in
Q31: The graph below shows the numbers, in
Q32: Below is a graph of a function
Q33: The graph below shows the maximum angle
Q34: The graph below shows the fundraising of
Q35: The graph below shows the atmospheric pressure,
Q36: Which of the following stories best fits
Q38: The graph below shows the growth rate
Unlock this Answer For Free Now!
View this answer and more for free by performing one of the following actions

Scan the QR code to install the App and get 2 free unlocks

Unlock quizzes for free by uploading documents