Multiple Choice
Use the given table or graph to write the inequality described.
-The bar graph below shows the number of students by major in the College of Arts and Sciences.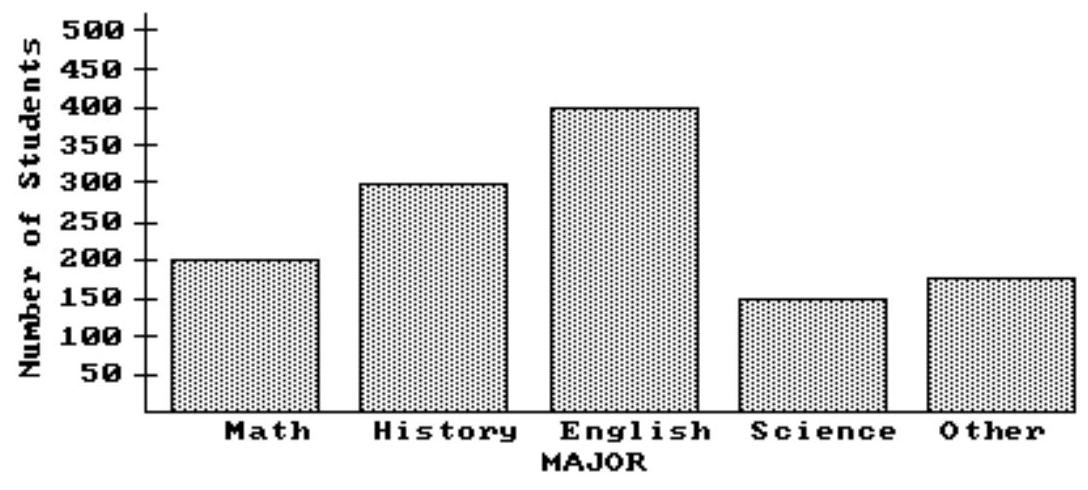
Use an inequality to compare the number of math and english majors.
A)
B)
C)
D)
Correct Answer:
Verified
Related Questions

