Multiple Choice
Use the given table or graph to write the inequality described.
-The sales figures for the Big "D" Company area shown below in a line plot. 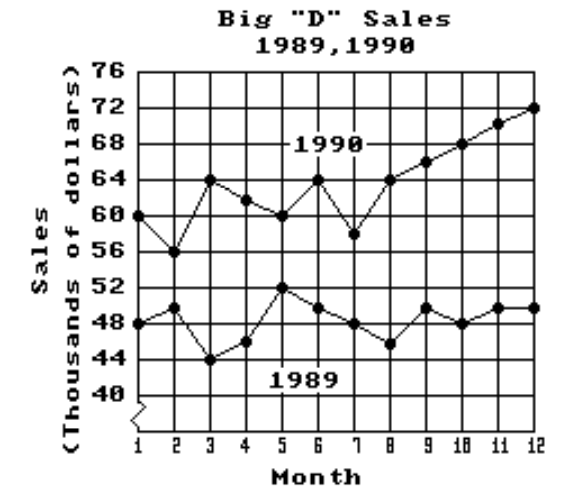
Use an inequality to compare the sales for January 1990 and December 1990.
A)
B)
C)
D)
Correct Answer:
Verified
Related Questions

