Multiple Choice
Use the given table or graph to write the inequality described.
-The sales figures for the Big "D" Company area shown below in a line plot. 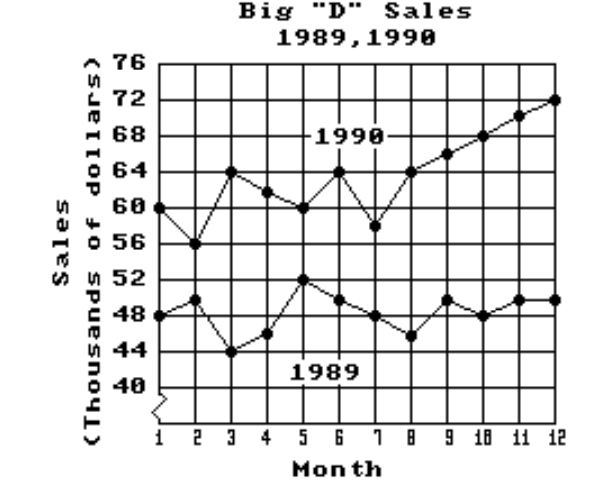
Use an inequality to compare the sales for July 1989 and July 1990.
A)
B)
C)
D)
Correct Answer:
Verified
Related Questions
Q60: Use < or > for
Q61: Use < or > for
Q62: Use < or > for
Q63: Use the given table or graph
Q64: Use the given table or graph
Q66: Use the given table or graph
Q67: Use the given table or graph
Q68: Use the given table or graph
Q69: Add. Q70: Add.
-![]()
-![]()
Unlock this Answer For Free Now!
View this answer and more for free by performing one of the following actions

Scan the QR code to install the App and get 2 free unlocks

Unlock quizzes for free by uploading documents