TABLE 15-4

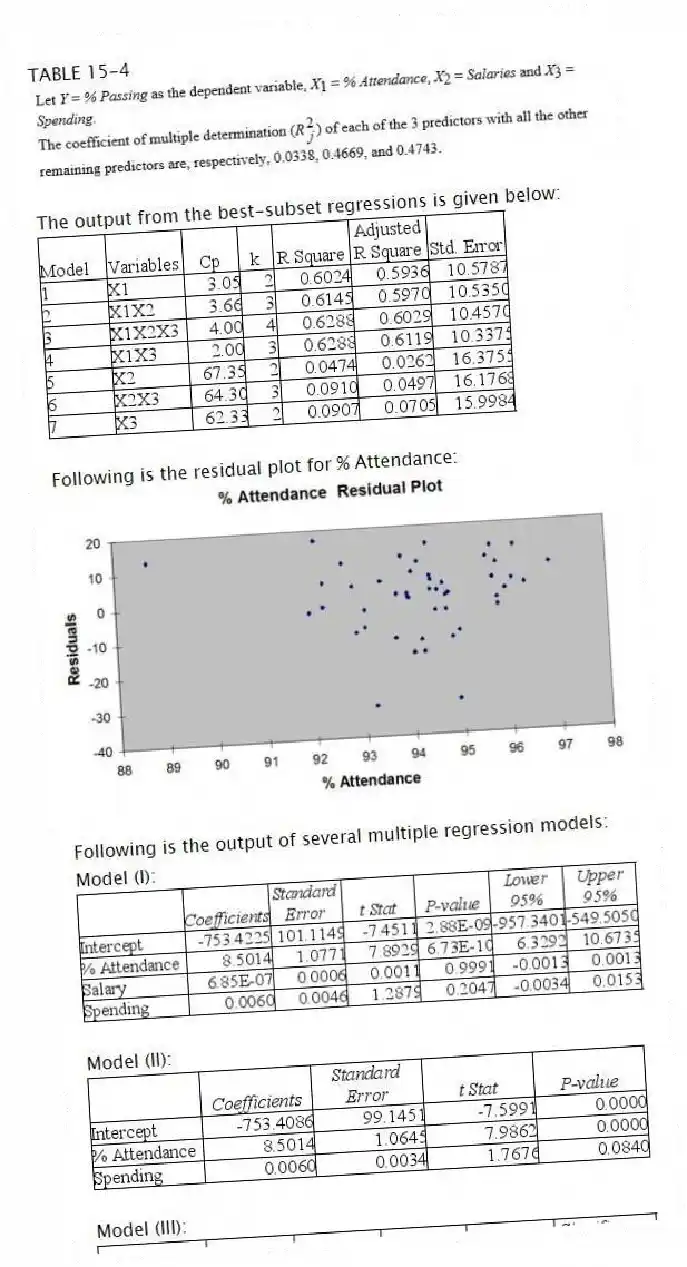
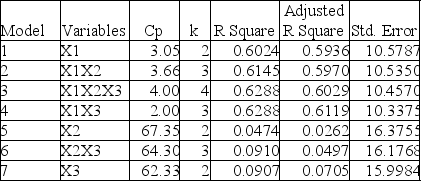
The output from the best-subset regressions is given below:

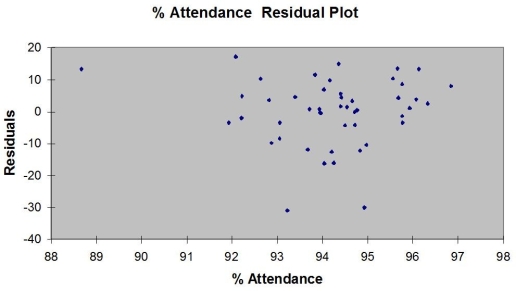
Following is the residual plot for % Attendance:

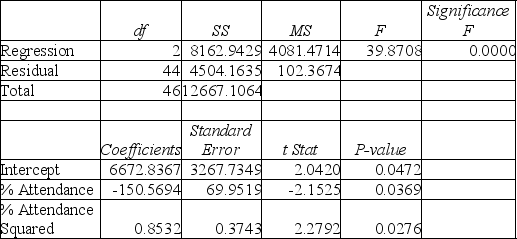
Following is the output of several multiple regression models:
Model (I):

Model (II):

Model (III):

-Referring to Table 15-4, the residual plot suggests that a nonlinear model on % attendance may be a better model.
Correct Answer:
Verified
Q12: One of the consequences of collinearity in
Q30: In data mining where huge data sets
Q32: The _ (larger/smaller)the value of the Variance
Q37: TABLE 15-3
A chemist employed by a pharmaceutical
Q38: TABLE 15-3
A chemist employed by a pharmaceutical
Q39: TABLE 15-3
A chemist employed by a pharmaceutical
Q41: TABLE 15-4 Q44: An independent variable Xⱼ is considered highly Q45: TABLE 15-4 Q46: TABLE 15-4 Unlock this Answer For Free Now! View this answer and more for free by performing one of the following actions Scan the QR code to install the App and get 2 free unlocks Unlock quizzes for free by uploading documents
![]()
![]()
![]()

