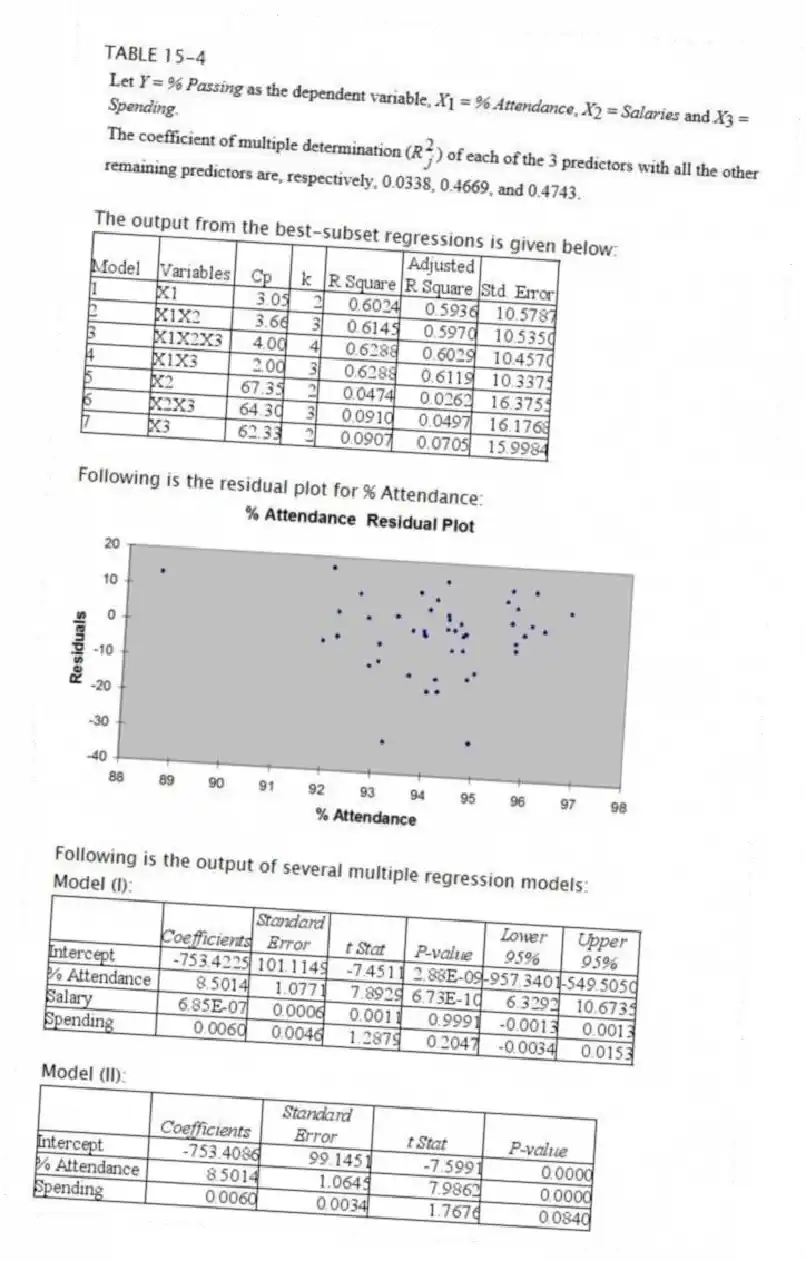
Solved

TABLE 15-4 The Output from the Best-Subset Regressions Is Given Below

Question 41

True/False
TABLE 15-4
  
The output from the best-subset regressions is given below:
  
Following is the residual plot for % Attendance:
  
Following is the output of several multiple regression models:
Model (I):
  
Model (II):
  
Model (III):
 
-Referring to Table 15-4, there is reason to suspect collinearity between some pairs of predictors.

TABLE 15-4
TABLE 15-4     The output from the best-subset regressions is given below:     Following is the residual plot for % Attendance:     Following is the output of several multiple regression models: Model (I):     Model (II):     Model (III):    -Referring to Table 15-4, there is reason to suspect collinearity between some pairs of predictors.
The output from the best-subset regressions is given below:
TABLE 15-4     The output from the best-subset regressions is given below:     Following is the residual plot for % Attendance:     Following is the output of several multiple regression models: Model (I):     Model (II):     Model (III):    -Referring to Table 15-4, there is reason to suspect collinearity between some pairs of predictors.
Following is the residual plot for % Attendance:
TABLE 15-4     The output from the best-subset regressions is given below:     Following is the residual plot for % Attendance:     Following is the output of several multiple regression models: Model (I):     Model (II):     Model (III):    -Referring to Table 15-4, there is reason to suspect collinearity between some pairs of predictors.
Following is the output of several multiple regression models:
Model (I):
TABLE 15-4     The output from the best-subset regressions is given below:     Following is the residual plot for % Attendance:     Following is the output of several multiple regression models: Model (I):     Model (II):     Model (III):    -Referring to Table 15-4, there is reason to suspect collinearity between some pairs of predictors.
Model (II):
TABLE 15-4     The output from the best-subset regressions is given below:     Following is the residual plot for % Attendance:     Following is the output of several multiple regression models: Model (I):     Model (II):     Model (III):    -Referring to Table 15-4, there is reason to suspect collinearity between some pairs of predictors.
Model (III):
TABLE 15-4     The output from the best-subset regressions is given below:     Following is the residual plot for % Attendance:     Following is the output of several multiple regression models: Model (I):     Model (II):     Model (III):    -Referring to Table 15-4, there is reason to suspect collinearity between some pairs of predictors.
-Referring to Table 15-4, there is reason to suspect collinearity between some pairs of predictors.

Correct Answer:

verifed

Verified

Unlock this answer now
Get Access to more Verified Answers free of charge

Related Questions

Unlock this Answer For Free Now!

View this answer and more for free by performing one of the following actions

qr-code

Scan the QR code to install the App and get 2 free unlocks

upload documents

Unlock quizzes for free by uploading documents