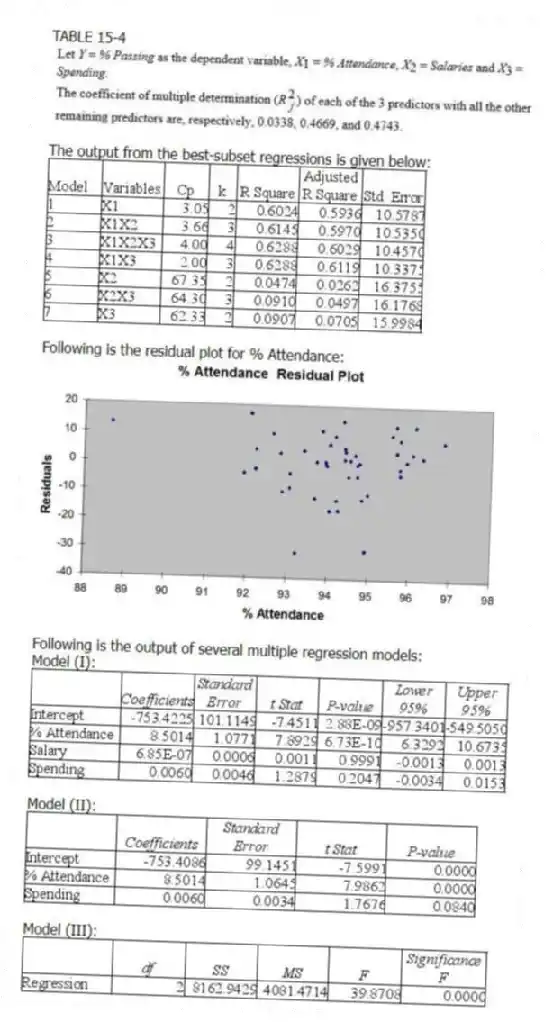
TABLE 15-4

The output from the best-subset regressions is given below:

Following is the residual plot for % Attendance:

Following is the output of several multiple regression models:
Model (I) :

Model (II) :

Model (III) :

-Referring to Table 15-4, the better model using a 5% level of significance derived from the "best" model above is
A) X₁.
B) X₃.
C) X₁,X₃.
D) X₁,X₂,X₃.
Correct Answer:
Verified
Q12: One of the consequences of collinearity in
Q25: The logarithm transformation can be used
A)to overcome
Q26: A regression diagnostic tool used to study
Q30: In data mining where huge data sets
Q32: The _ (larger/smaller)the value of the Variance
Q41: TABLE 15-4 Q42: TABLE 15-4 Q44: An independent variable Xⱼ is considered highly Q46: TABLE 15-4 Q48: Using the Cp statistic in model building, Unlock this Answer For Free Now! View this answer and more for free by performing one of the following actions Scan the QR code to install the App and get 2 free unlocks Unlock quizzes for free by uploading documents
![]()
![]()
![]()

