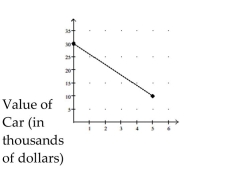
Find the average rate of change illustrated in the graph.
- Year
Year
A) -$5000.00 per year
B) $4000.00 per year
C) -$4000.00 per year
D) $5000.00 per year
Correct Answer:
Verified
Q246: Find the average rate of change
Q247: Graph the line described.
-through
Q248: Find the average rate of change illustrated
Q249: Find the average rate of change
Q250: Find the average rate of change
Q252: Choose the value which could represent
Q253: Find the average rate of change illustrated
Q254: Graph the line described.
-
Q255: Find the average rate of change illustrated
Q256: Choose the value which could represent
Unlock this Answer For Free Now!
View this answer and more for free by performing one of the following actions

Scan the QR code to install the App and get 2 free unlocks

Unlock quizzes for free by uploading documents