Find the average rate of change illustrated in the graph.
-A school has just purchased new computer equipment for $23,000.00. The graph shows the depreciation of the equipment over 5 years. The point (0, 23,000) represents the purchase price and the point (5, 0) represents when
The equipment will be replaced. Find and interpret the average rate of change in cost per year. 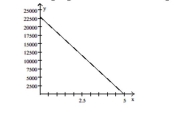
A) per year; the value of the equipment decreases by per year during these years.
B) - per year; the value of the equipment decreases by per year during these years.
C) per year; the value of the equipment increases by per year during these years.
D) per year; the value of the equipment decreases by per year during these years.
Correct Answer:
Verified
Q244: Find the average rate of change
Q245: Choose the value which could represent
Q246: Find the average rate of change
Q247: Graph the line described.
-through
Q248: Find the average rate of change illustrated
Q250: Find the average rate of change
Q251: Find the average rate of change illustrated
Q252: Choose the value which could represent
Q253: Find the average rate of change illustrated
Q254: Graph the line described.
-
Unlock this Answer For Free Now!
View this answer and more for free by performing one of the following actions

Scan the QR code to install the App and get 2 free unlocks

Unlock quizzes for free by uploading documents