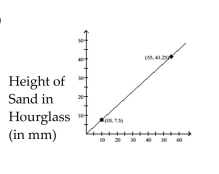
Find the average rate of change illustrated in the graph.
- Time (in seconds)
A) 0.75 mm per second
B) 1.3 mm per second
C) 1 mm per second
D) 0.85 mm per second
Correct Answer:
Verified
Q250: Find the average rate of change
Q251: Find the average rate of change illustrated
Q252: Choose the value which could represent
Q253: Find the average rate of change illustrated
Q254: Graph the line described.
-
Q256: Choose the value which could represent
Q257: Find the average rate of change illustrated
Q258: Graph the line described.
-
Q259: Choose the value which could represent
Q260: Graph the line described.
-
Unlock this Answer For Free Now!
View this answer and more for free by performing one of the following actions

Scan the QR code to install the App and get 2 free unlocks

Unlock quizzes for free by uploading documents